Blog

  • How to Build an Emergency Fund With Practical Examples

    How to Build an Emergency Fund With Practical Examples

    Life is unpredictable. A sudden medical emergency, unexpected job loss, urgent home repairs, or even a car breakdown can create financial stress if you are not prepared. Many people rely on credit cards or loans during emergencies, which often leads to long term debt.

    This is where an emergency fund becomes one of the most important components of personal finance. An emergency fund provides a financial safety net that helps you manage unexpected situations without disrupting your financial stability.

    In this guide, we will explain what an emergency fund is, why it is essential, and how you can build one step by step.


    What is an Emergency Fund

    An emergency fund is money set aside specifically for unexpected financial situations. It is not meant for planned expenses such as vacations, shopping, or gadgets.

    This fund should only be used for genuine emergencies such as

    Medical emergencies
    Job loss or sudden income reduction
    Urgent home repairs
    Vehicle repairs
    Family emergencies

    Having an emergency fund ensures that you can handle these situations without relying on high interest debt.


    Why an Emergency Fund is Important

    Many individuals live from paycheck to paycheck and have little financial buffer. When unexpected expenses arise, they often borrow money, which can create additional financial pressure.

    An emergency fund provides several benefits.

    Financial security during uncertain situations
    Reduced reliance on credit cards or loans
    Peace of mind during financial emergencies
    Protection for long term investments and savings

    Without an emergency fund, people often withdraw money from investments or retirement savings, which disrupts long term financial goals.


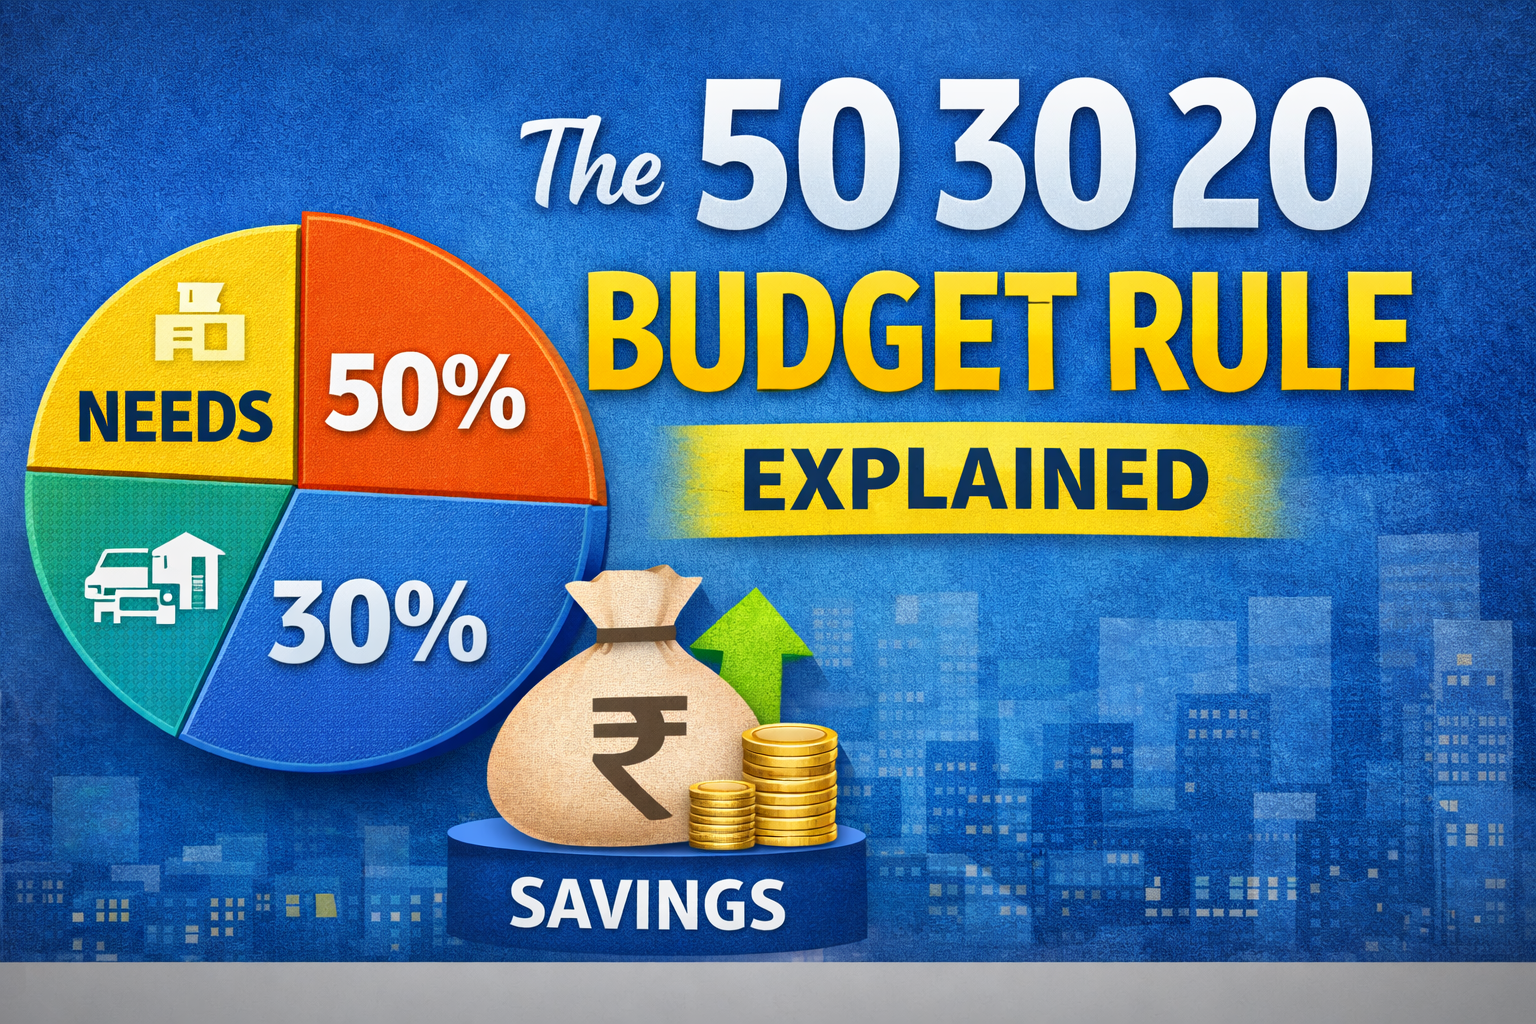
    How Much Money Should You Save

    Financial experts generally recommend saving three to six months of living expenses in an emergency fund.

    The exact amount depends on factors such as income stability, family responsibilities, and job security.

    Example

    Let us consider Rohan, who has the following monthly expenses.

    Rent: 18000
    Groceries: 6000
    Transportation: 3000
    Utilities: 2000
    Insurance: 2000
    Other essential expenses: 4000

    Total monthly essential expenses = 35000

    If Rohan wants to maintain a six month emergency fund, the calculation would be

    35000 x 6 = 210000

    Rohan should aim to gradually build an emergency fund of around 210000.


    Start With a Small Initial Goal

    Building a large emergency fund may seem overwhelming at first. Instead of focusing on the final amount immediately, start with a smaller goal.

    For example

    First goal: 10000
    Second goal: 50000
    Final goal: three to six months of expenses

    Small milestones make the process more achievable and motivating.


    Create a Dedicated Emergency Fund Account

    It is important to keep emergency savings separate from regular spending accounts. If the money is easily accessible in your main account, there is a higher chance of spending it unnecessarily.

    Suitable places to keep emergency funds include

    Savings accounts
    Liquid mutual funds
    Money market funds

    These options provide both safety and easy access when required.


    Automate Your Savings

    One of the easiest ways to build an emergency fund is by automating monthly contributions.

    For example

    Monthly income: 60000
    Automatic emergency fund transfer: 5000

    In one year

    5000 x 12 = 60000

    Within two to three years, this approach can help build a strong financial cushion.

    Automation ensures consistency and reduces the temptation to skip savings.


    Reduce Unnecessary Expenses

    Another effective way to accelerate emergency fund growth is by reducing discretionary spending.

    Consider the following example.

    Daily coffee purchases: 150
    Monthly cost: 4500

    Food delivery spending: 4000 per month

    By reducing these expenses slightly, an individual could redirect nearly 6000 to 8000 per month toward building an emergency fund.

    Small lifestyle adjustments can make a significant difference over time.


    Use Unexpected Income Wisely

    Occasionally, individuals receive extra income such as bonuses, tax refunds, or freelance payments.

    Instead of spending the entire amount, allocating a portion toward emergency savings can significantly accelerate progress.

    Example

    Bonus received: 30000

    Allocation strategy

    Emergency fund: 15000
    Investments: 10000
    Personal spending: 5000

    Using extra income strategically helps build financial security faster.


    When Should You Use Your Emergency Fund

    An emergency fund should only be used for genuine financial emergencies.

    Appropriate situations include

    Medical emergencies
    Loss of employment
    Urgent home or vehicle repairs
    Unexpected family financial obligations

    It should not be used for

    Shopping or lifestyle purchases
    Vacations or travel
    Non urgent upgrades

    After using part of the emergency fund, the next financial priority should be rebuilding it.


    Common Mistakes to Avoid

    Many people struggle to build emergency funds due to common mistakes.

    Using emergency savings for non emergency expenses
    Keeping the fund in risky investments such as stocks
    Setting unrealistic savings targets
    Ignoring emergency savings completely

    A disciplined approach ensures that the fund remains available when truly needed.


    Real Life Scenario

    Consider two individuals, Arjun and Vikram.

    Arjun has no emergency savings. When his car requires urgent repairs costing 25000, he uses a credit card with high interest rates. It takes several months to repay the debt.

    Vikram has an emergency fund of 100000. When faced with the same repair cost, he pays directly from his savings without financial stress.

    This example demonstrates how emergency funds protect financial stability.


    Final Thoughts

    An emergency fund is the foundation of financial security. It protects individuals from unexpected financial shocks and allows them to manage emergencies without relying on debt.

    Building an emergency fund requires patience, discipline, and consistency. Even small monthly contributions can gradually create a strong financial safety net.

    Once an emergency fund is established, individuals can focus more confidently on investing and long term wealth building.

  • The 50 30 20 Budget Rule Explained With Practical Examples

    The 50 30 20 Budget Rule Explained With Practical Examples

    Managing money does not have to be complicated. Many people struggle with budgeting simply because they feel overwhelmed by complex financial advice. The 50 30 20 rule offers a simple and practical framework that helps individuals manage their income, control spending, and build savings without complicated calculations.

    This budgeting rule divides your income into three clear categories: needs, wants, and savings. By following this structure, individuals can create a balanced financial plan that supports both current lifestyle and future financial security.


    What is the 50 30 20 Budget Rule

    The 50 30 20 rule is a simple budgeting method that divides your after tax income into three parts.

    50 percent for needs
    30 percent for wants
    20 percent for savings and investments

    This framework helps people maintain a balance between essential expenses, lifestyle spending, and long term financial planning.

    The rule was popularized by Elizabeth Warren, a US senator and financial expert, in her book on personal finance.


    Understanding the Three Budget Categories

    To use the 50 30 20 rule effectively, it is important to clearly understand the three categories.

    1 Needs 50 Percent of Income

    Needs include all essential expenses required for daily living and financial obligations. These are expenses you cannot easily avoid.d

    Common examples include

    Rent or home loan payments
    Groceries
    Utilities such as electricity and water
    Transportation costs
    Insurance premiums
    Minimum debt payments

    Example

    Suppose Priya earns 80000 per month after taxes.

    According to the rule

    Needs budget = 50 percent of income

    Needs allocation
    80000 x 50 percent = 40000

    Priya’s essential expenses might look like this

    Rent: 20000
    Groceries: 6000
    Transportation: 4000
    Utilities: 3000
    Insurance: 3000
    Loan payment: 4000

    Total needs spending: 40000

    By keeping her essential expenses within this limit, Priya ensures that she does not overspend on necessities.


    2 Wants 30 Percent of Income

    Wants include discretionary spending that improves lifestyle but is not essential for survival.

    Examples include

    Dining out
    Entertainment subscriptions
    Travel
    Shopping
    Gym memberships
    Streaming services

    These expenses make life enjoyable but can easily grow out of control without a spending limit.

    Example

    Priya allocates 30 percent of her income to wants.

    80000 x 30 percent = 24000

    Her lifestyle spending might look like

    Dining out: 6000
    Shopping: 7000
    Entertainment and subscriptions: 3000
    Weekend activities: 4000
    Travel savings: 4000

    Total wants spending: 24000

    This allows Priya to enjoy her lifestyle without compromising her financial stability.


    3 Savings and Investments 20 Percent of Income

    The final 20 percent of income should be allocated toward building financial security and long term wealth.

    This category includes

    Emergency fund savings
    Retirement savings
    Mutual fund investments
    Stock investments
    Debt repayment beyond minimum payments

    Example

    Priya allocates 20 percent of her income to savings.

    80000 x 20 percent = 16000

    Her allocation might include

    Mutual fund SIP: 8000
    Emergency fund savings: 5000
    Stock investments: 3000

    Over time, consistent savings and investments can significantly grow wealth.


    Why the 50 30 20 Rule Works

    This rule is effective because it creates a clear balance between spending and saving.

    Many people either overspend on lifestyle expenses or save too little for the future. The 50 30 20 framework prevents both extremes.

    Key benefits include

    Simple structure that is easy to follow
    Encourages disciplined spending
    Ensures consistent savings
    Maintains financial balance

    It is particularly useful for individuals who are new to budgeting.


    Real Life Example of the 50 30 20 Rule

    Let us consider another example.

    Aman earns 60000 per month after taxes.

    Using the 50 30 20 rule

    Needs 50 percent = 30000
    Wants 30 percent = 18000
    Savings 20 percent = 12000

    His budget may look like

    Needs
    Rent: 15000
    Groceries: 5000
    Transportation: 3000
    Utilities: 2000
    Insurance: 3000
    Loan payment: 2000

    Wants
    Dining out: 5000
    Shopping: 6000
    Entertainment: 3000
    Travel fund: 4000

    Savings
    Emergency fund: 5000
    Mutual fund SIP: 5000
    Stock investments: 2000

    By following this framework, Aman ensures that his finances remain structured and sustainable.


    When the 50 30 20 Rule May Need Adjustment

    While this rule works well for many people, it may need adjustments depending on personal circumstances.

    For example

    In expensive cities, housing costs may exceed 50 percent of income.
    Individuals with large education loans may allocate more than 20 percent toward debt repayment.
    High income individuals may choose to save more than 20 percent.

    The rule should be treated as a guideline rather than a strict rule.


    Tips to Implement the 50 30 20 Rule Successfully

    Start by tracking all monthly expenses
    Identify which expenses fall into each category
    Reduce unnecessary wants if savings are too low
    Automate savings transfers each month
    Review and adjust spending regularly

    Small adjustments can make a significant difference over time.


    Final Thoughts

    The 50 30 20 rule offers a simple yet powerful way to manage personal finances. By dividing income into needs, wants, and savings, individuals can create a balanced financial plan that supports both present lifestyle and future financial goals.

    The key to success is consistency. Even small savings contributions made regularly can grow significantly over time.

    For beginners in personal finance, this rule provides a practical starting point for building healthy financial habits.

  • How to Create a Monthly Budget Step by Step

    How to Create a Monthly Budget Step by Step

    Most people believe budgeting means restricting their lifestyle or constantly worrying about money. In reality, budgeting is simply a way of telling your money where to go instead of wondering where it went.

    A well designed budget helps you control spending, increase savings, and achieve financial goals such as buying a home, traveling, or building long term wealth.

    In this guide, we will walk through a practical step by step process to create a monthly budget that actually works.


    Why Budgeting is Important

    Many people earn a good income but still struggle financially. The reason is usually not low income but lack of financial planning.

    Without a budget, money often gets spent on small daily expenses that gradually accumulate into large monthly spending.

    For example

    Daily coffee: 200
    Monthly cost: 6000

    Online subscriptions: 1000
    Food delivery: 4000

    These expenses might look small individually, but together they can consume a large portion of income.

    A budget helps you

    Control spending
    Avoid unnecessary debt
    Build savings consistently
    Plan for future financial goals


    Understand Your Total Monthly Income

    The first step in budgeting is knowing exactly how much money you earn every month.

    Your income may come from different sources such as

    Salary
    Freelance work
    Business income
    Investment income

    For budgeting purposes, always consider net income, which is the money you receive after taxes and deductions.

    Example

    Rahul earns

    Monthly salary: 60000
    Freelance work: 10000

    Total monthly income: 70000

    This amount becomes the starting point for creating his budget.


    Track All Your Expenses

    Before creating a budget, it is important to understand where your money is currently going.

    Expenses can be divided into two categories.

    Fixed Expenses

    These expenses remain relatively constant each month.

    Examples

    Rent
    Loan payments
    Insurance premiums
    Internet bills

    Variable Expenses

    These expenses fluctuate every month.

    Examples

    Food
    Entertainment
    Shopping
    Transportation

    Tracking expenses for at least one month helps identify spending habits.

    Example Expense Tracking

    Rahul tracks his expenses for one month.

    Rent: 20000
    Groceries: 6000
    Transportation: 3000
    Food delivery: 5000
    Shopping: 4000
    Entertainment: 3000
    Utilities: 2000

    Total expenses: 43000

    By analyzing his expenses, Rahul realizes that he spends more than expected on food delivery and shopping.


    Categorize Your Spending

    Once you understand your expenses, the next step is to categorize them.

    Common budget categories include

    Housing
    Food
    Transportation
    Utilities
    Entertainment
    Savings
    Investments

    Categorization helps identify areas where spending can be optimized.

    For example

    If food delivery expenses are very high, cooking at home more often can significantly reduce costs.


    Apply the 50 30 20 Budget Rule

    One of the simplest budgeting frameworks is the 50 30 20 rule.

    This rule divides income into three categories.

    50 percent for essential needs
    30 percent for lifestyle wants
    20 percent for savings and investments

    Example

    If Rahul earns 70000 per month

    Needs: 35000
    Wants: 21000
    Savings and investments: 14000

    Needs include rent, groceries, utilities, and transportation.

    Wants include dining out, entertainment, shopping, and travel.

    Savings include emergency funds, investments, and retirement planning.

    This structure helps maintain a healthy balance between spending and saving.


    Reduce Unnecessary Expenses

    Once spending patterns are identified, the next step is optimizing expenses.

    Many people discover that they spend large amounts on non essential purchases.

    Example

    Rahul decides to reduce

    Food delivery from 5000 to 2500
    Shopping from 4000 to 2000

    Total monthly savings

    4500

    He decides to invest this extra money in mutual funds.

    Over time, small changes like this can significantly increase wealth.


    Automate Savings

    Saving money becomes much easier when it is automated.

    Instead of saving whatever remains at the end of the month, it is better to save first and spend the rest.

    For example

    Income: 70000
    Automatic savings transfer: 10000

    Remaining spending budget: 60000

    This ensures savings happen consistently.


    Review Your Budget Every Month

    Budgeting is not a one time exercise. It should evolve with changes in income, expenses, and financial goals.

    At the end of every month

    Review spending patterns
    Adjust spending limits
    Increase savings when possible

    This continuous improvement helps build stronger financial discipline.


    Common Budgeting Mistakes

    Many people fail to maintain budgets because they make unrealistic plans.

    Common mistakes include

    Ignoring small daily expenses
    Setting unrealistic spending limits
    Not tracking expenses regularly
    Failing to adjust budgets when income changes

    A successful budget should be practical and flexible.


    Budgeting Tools You Can Use

    Several tools can help simplify budgeting.

    Spreadsheet budgeting
    Expense tracking apps
    Bank spending analytics

    These tools provide better visibility into financial habits.


    Final Thoughts

    Creating a monthly budget is one of the most powerful steps toward financial stability.

    It does not require complicated financial knowledge. It simply requires awareness, discipline, and consistency.

    By understanding income, tracking expenses, and allocating money wisely, anyone can build stronger financial habits and achieve long term financial goals.

    Budgeting is not about limiting your lifestyle. It is about creating a financial plan that supports the life you want to live.

  • Module 8: Fixed Income

    Fixed income securities are financial instruments that provide investors with regular interest payments and repayment of principal at maturity. These securities are widely used by governments, corporations, and financial institutions to raise capital.

    Investors purchase fixed income securities to earn stable income and diversify their investment portfolios. Compared to equities, fixed income investments generally offer lower risk and more predictable cash flows.

    The most common fixed income securities include bonds issued by governments, corporations, and municipalities.

    This module introduces the characteristics of fixed income securities, bond valuation techniques, interest rate risk measures, and credit risk analysis.


    8.1 Features of Fixed Income Securities

    Fixed income securities have several key characteristics that determine their value and risk profile.


    Face Value

    Face value, also known as par value, is the amount that the issuer agrees to repay the bondholder at maturity.

    Most bonds have a face value of 1000, although this may vary depending on the issuer and market.


    Coupon Rate

    The coupon rate represents the annual interest payment made to bondholders.

    Coupon Payment Formula

    Annual Coupon Payment = Face Value × Coupon Rate

    For example, if a bond has a face value of 1000 and a coupon rate of 6 percent, the annual interest payment will be 60.


    Maturity Date

    The maturity date is the date when the issuer repays the principal amount to the bondholder.

    Bonds may have different maturities such as:

    Short term bonds (less than 3 years)
    Medium term bonds (3 to 10 years)
    Long term bonds (more than 10 years)


    Issuer

    Bonds can be issued by different entities, including:

    Government bonds
    Issued by national governments.

    Corporate bonds
    Issued by companies to finance business operations.

    Municipal bonds
    Issued by local governments.


    8.2 Bond Pricing and Valuation

    The value of a bond is determined by discounting its future cash flows, which include periodic coupon payments and repayment of principal.

    Bond Price Formula

    Bond Price = Present value of coupon payments + Present value of face value

    More specifically:

    Bond Price = C/(1+r)^1 + C/(1+r)^2 + … + C/(1+r)^n + FV/(1+r)^n

    Where

    C = coupon payment
    FV = face value
    r = required rate of return
    n = number of periods


    Bond Price and Interest Rates

    Bond prices and interest rates have an inverse relationship.

    When interest rates increase, bond prices decrease.

    When interest rates decrease, bond prices increase.

    This relationship occurs because new bonds issued in the market reflect current interest rates.


    8.3 Yield Measures

    Yield measures represent the return an investor earns from holding a bond.

    Several yield measures are commonly used in fixed income analysis.


    Current Yield

    Current yield measures the annual income generated by the bond relative to its market price.

    Current Yield Formula

    Current Yield = Annual Coupon Payment / Bond Price

    Example
    If a bond pays 60 annually and the bond price is 950, the current yield is approximately 6.32 percent.


    Yield to Maturity (YTM)

    Yield to maturity represents the total return an investor will earn if the bond is held until maturity.

    YTM considers:

    • coupon payments
    • capital gain or loss
    • time remaining to maturity

    YTM is the most widely used measure of bond returns.


    Yield to Call

    Some bonds allow the issuer to repay the bond before maturity.

    Yield to call measures the return assuming the bond is called before maturity.


    8.4 Term Structure of Interest Rates

    The term structure of interest rates describes the relationship between bond yields and their maturity periods.

    This relationship is commonly represented by the yield curve.


    Types of Yield Curves

    Normal Yield Curve
    Long term interest rates are higher than short term rates.

    Inverted Yield Curve
    Short term rates are higher than long term rates.

    Flat Yield Curve
    Short term and long term rates are similar.

    Yield curves provide insights into economic expectations and future interest rate movements.


    8.5 Duration and Convexity

    Duration and convexity measure the sensitivity of bond prices to changes in interest rates.


    Duration

    Duration measures how much a bond’s price changes when interest rates change.

    Approximate Price Change Formula

    Percentage Change in Bond Price = − Duration × Change in Interest Rate

    Key observations:

    • Bonds with longer maturity have higher duration.
    • Bonds with lower coupon rates have higher duration.

    Higher duration means greater interest rate risk.


    Convexity

    Convexity measures the curvature of the relationship between bond prices and interest rates.

    It improves the accuracy of bond price estimates when interest rates change significantly.

    Bonds with higher convexity experience less price decline when interest rates rise and greater price increase when interest rates fall.


    8.6 Credit Risk Analysis

    Credit risk refers to the possibility that the bond issuer may fail to make interest payments or repay the principal.

    Investors must evaluate the creditworthiness of bond issuers before investing.


    Credit Ratings

    Credit rating agencies evaluate the financial strength of issuers and assign credit ratings.

    Major rating agencies include:

    • Standard and Poor’s
    • Moody’s
    • Fitch

    Ratings typically range from high quality investment grade bonds to high risk speculative bonds.


    Investment Grade Bonds

    Investment grade bonds have relatively low default risk.

    These bonds are considered safer investments.


    High Yield Bonds

    High yield bonds, also known as junk bonds, offer higher interest rates to compensate investors for higher risk.

    These bonds are issued by companies with weaker financial profiles.


    Credit Spread

    Credit spread represents the difference in yield between a corporate bond and a government bond of similar maturity.

    Higher credit spreads indicate higher perceived credit risk.


    Importance of Fixed Income Securities

    Fixed income securities play an important role in investment portfolios because they:

    • provide stable income
    • reduce portfolio volatility
    • offer diversification benefits
    • help preserve capital

    They are commonly used by pension funds, insurance companies, and conservative investors seeking predictable returns.

  • The Complete Guide to Personal Finance for Beginners

    The Complete Guide to Personal Finance for Beginners

    Managing money is one of the most important life skills, yet many people never receive formal education on personal finance. Personal finance refers to how individuals manage their income, expenses, savings, and investments to achieve financial stability and long term wealth.

    This guide explains the fundamentals of personal finance including budgeting, saving, investing, and financial planning. By understanding these principles, anyone can take control of their financial future.


    What is Personal Finance

    Personal finance refers to the management of financial resources such as income, spending, saving, and investing. It involves making financial decisions that help individuals achieve both short term and long term goals.

    Personal finance generally includes five key areas:

    • Income management
    • Budgeting and spending
    • Saving and emergency funds
    • Investing and wealth creation
    • Risk management and insurance

    When these elements are properly managed, individuals can achieve financial stability and independence.


    Why Personal Finance is Important

    Financial planning helps individuals manage uncertainty and prepare for future expenses.

    Key benefits include:

    Financial security
    Effective money management
    Preparedness for emergencies
    Ability to achieve long term goals
    Reduced financial stress

    Without proper financial planning, people often fall into debt, overspend, or fail to save for important life goals.


    Understanding Income and Expenses

    The first step in personal finance is understanding how money flows in and out.

    Income refers to the money an individual earns through salary, business income, freelance work, or investments.

    Expenses include all spending such as rent, groceries, transportation, entertainment, and debt payments.

    Tracking income and expenses helps identify unnecessary spending and allows individuals to allocate money more effectively.

    Supporting article idea
    How to Track Expenses Effectively


    Creating a Personal Budget

    A budget is a financial plan that outlines how income will be allocated toward expenses, savings, and investments.

    One popular budgeting framework is the 50 30 20 rule.

    50 percent for needs
    30 percent for wants
    20 percent for savings and investments

    Budgeting helps maintain financial discipline and prevents overspending.

    Supporting article idea
    50 30 20 Rule Explained


    Building an Emergency Fund

    An emergency fund is money set aside to cover unexpected financial situations such as medical emergencies, job loss, or urgent repairs.

    Financial experts generally recommend maintaining three to six months of living expenses as an emergency fund.

    This fund should be easily accessible and kept in a liquid account such as a savings account.

    Supporting article idea
    How to Build an Emergency Fund


    Managing Debt Effectively

    Debt is common, but improper management can lead to serious financial stress.

    Common types of debt include:

    Credit card debt
    Personal loans
    Education loans
    Home loans

    Strategies to manage debt include:

    Paying high interest debt first
    Avoiding unnecessary borrowing
    Maintaining a strong credit score

    Responsible debt management improves financial stability and borrowing capacity.

    Supporting article idea
    How to Pay Off Debt Faster


    Importance of Saving

    Saving money is essential for achieving financial goals and preparing for future needs.

    Savings may be used for:

    Emergency funds
    Short term goals
    Major purchases
    Education expenses

    Developing a consistent saving habit builds financial discipline and prepares individuals for long term investment opportunities.

    Supporting article idea
    How to Save Money Effectively


    Introduction to Investing

    Saving helps preserve money, but investing helps grow wealth.

    Investing involves allocating money into assets that have the potential to generate returns over time.

    Common investment options include:

    Stocks
    Mutual funds
    Bonds
    Real estate
    Index funds

    Investing early allows individuals to benefit from the power of compounding, which significantly increases long term wealth.

    Supporting article idea
    Investing for Beginners


    Risk Management and Insurance

    Unexpected events such as illness, accidents, or natural disasters can create financial burdens.

    Insurance helps manage these risks by providing financial protection.

    Common types of insurance include:

    Health insurance
    Life insurance
    Property insurance
    Vehicle insurance

    Insurance ensures financial stability even during unexpected circumstances.

    Supporting article idea
    Importance of Insurance in Financial Planning


    Setting Financial Goals

    Financial goals help guide financial decisions and motivate disciplined saving and investing.

    Examples include:

    Buying a home
    Funding education
    Starting a business
    Retirement planning

    Goals should be specific, measurable, and time bound.


    Steps to Build a Strong Personal Finance Strategy

    To manage finances effectively, individuals can follow these steps.

    Track income and expenses
    Create a monthly budget
    Build an emergency fund
    Pay off high interest debt
    Start investing early
    Protect assets through insurance
    Review financial goals regularly

    Consistency and discipline are essential to building long term financial stability.


    Conclusion

    Personal finance is not about earning more money alone. It is about managing resources wisely, making informed financial decisions, and planning for the future.

    By learning budgeting, saving, investing, and risk management, individuals can build financial security and achieve their life goals.

    Developing strong personal finance habits today can create a stable and prosperous financial future.

  • Module 7: Equity Investments

    Equity investments represent ownership in a company. When investors purchase shares of a company, they become partial owners and are entitled to a portion of the company’s profits and assets.

    Equity markets allow companies to raise capital for growth and expansion while providing investors with opportunities to earn returns through capital appreciation and dividends.

    Equity investments play a central role in portfolio management and long term wealth creation.

    This module introduces the structure of equity markets, the concept of market efficiency, and the fundamental methods used to value stocks.


    7.1 Market Structure

    Equity markets are organized systems where investors buy and sell shares of publicly listed companies.

    These markets facilitate the transfer of ownership between investors and allow companies to raise capital.

    Equity markets operate through two main segments.


    Primary Market

    The primary market is where new securities are issued for the first time. In this market, companies raise capital directly from investors.

    When a company wants to raise funds, it can issue shares through processes such as:

    Initial Public Offering (IPO)
    A private company offers shares to the public for the first time.

    Follow On Public Offering (FPO)
    A publicly listed company issues additional shares to raise more capital.

    Rights Issue
    Existing shareholders are given the right to purchase additional shares.

    The funds raised in the primary market go directly to the company to support business activities such as expansion, research, or debt repayment.


    Secondary Market

    The secondary market is where investors trade existing shares among themselves.

    Once shares are issued in the primary market, they begin trading on stock exchanges such as:

    • New York Stock Exchange
    • NASDAQ
    • London Stock Exchange
    • National Stock Exchange

    In the secondary market, the company does not receive funds from share trading. Instead, investors buy and sell shares based on their expectations about future performance.

    Secondary markets provide liquidity, allowing investors to easily buy or sell shares.


    7.2 Market Efficiency

    Market efficiency refers to how quickly and accurately financial markets incorporate information into stock prices.

    The Efficient Market Hypothesis states that stock prices reflect available information, making it difficult for investors to consistently outperform the market.

    There are three forms of market efficiency.


    Weak Form Efficiency

    In weak form efficiency, stock prices reflect all past trading information.

    This includes:

    • historical prices
    • trading volumes
    • past market trends

    If markets are weak form efficient, investors cannot earn abnormal profits using technical analysis based on historical data.


    Semi Strong Form Efficiency

    In semi strong form efficiency, stock prices reflect all publicly available information.

    This includes:

    • financial statements
    • company announcements
    • economic news
    • analyst reports

    If markets are semi strong efficient, investors cannot consistently achieve superior returns using fundamental analysis because new information is quickly incorporated into prices.


    Strong Form Efficiency

    Strong form efficiency assumes that stock prices reflect all information, including both public and private information.

    If markets were strongly efficient, even insiders with privileged information would not be able to consistently earn abnormal profits.

    In reality, most financial markets are considered semi strong efficient, while strong form efficiency rarely holds true.


    7.3 Equity Valuation

    Equity valuation is the process of estimating the intrinsic value of a company’s stock.

    Investors compare intrinsic value with the current market price to determine whether a stock is overvalued or undervalued.

    If intrinsic value is greater than market price, the stock may be considered undervalued and attractive to investors.

    If intrinsic value is lower than market price, the stock may be considered overvalued.

    Several models are used to estimate stock value.


    Dividend Discount Model

    The Dividend Discount Model values a stock based on the present value of expected future dividends.

    The basic idea is that the value of a stock equals the sum of all future dividend payments discounted to present value.

    Dividend Discount Model formula

    Stock Value = Dividend next year / (Required return − Dividend growth rate)

    Where

    Dividend next year = expected dividend payment
    Required return = investor’s required rate of return
    Growth rate = expected annual growth in dividends


    Constant Growth Dividend Model

    When dividends grow at a constant rate indefinitely, the Gordon Growth Model can be used.

    Stock Value = D1 / (r − g)

    Where

    D1 = expected dividend next year
    r = required rate of return
    g = constant growth rate of dividends


    Factors Affecting Equity Valuation

    Several factors influence stock valuation.

    Company earnings
    Higher earnings usually increase stock value.

    Growth potential
    Companies with strong growth prospects often trade at higher valuations.

    Risk level
    Higher risk may reduce the value investors are willing to pay.

    Interest rates
    Rising interest rates can reduce stock valuations.


    Importance of Equity Investments

    Equity investments are important because they:

    • provide long term capital growth
    • allow investors to participate in company profits
    • offer diversification opportunities
    • support economic growth by providing capital to businesses

    Equities are generally considered higher risk than bonds but often offer higher long term returns.

  • Module 6: Corporate Issuers

    Corporate finance focuses on how companies make financial decisions related to investments, financing, and managing day to day operations. The goal of corporate finance is to maximize shareholder value while maintaining financial stability.

    Corporate managers must decide:

    • Which projects the company should invest in
    • How those investments should be financed
    • How to manage short term financial resources

    This module explains the key concepts used by firms to make these decisions.


    6.1 Capital Budgeting

    Capital budgeting is the process companies use to evaluate and select long term investment projects.

    Examples of capital investment decisions include:

    • building a new manufacturing plant
    • launching a new product line
    • expanding into new markets
    • purchasing new machinery

    These projects usually require large initial investments and generate cash flows over many years. Financial managers must evaluate whether the expected benefits justify the cost.

    Several techniques are used to evaluate investment projects.


    Net Present Value (NPV)

    Net Present Value measures the difference between the present value of future cash flows and the initial investment.

    NPV formula

    NPV = Present value of future cash flows − Initial investment

    Decision rule:

    • If NPV is positive, the project increases shareholder value and should be accepted.
    • If NPV is negative, the project should be rejected.

    Example

    If a company invests 50,000 in a project expected to generate discounted cash flows worth 65,000, the NPV is positive and the project is financially attractive.


    Internal Rate of Return (IRR)

    The Internal Rate of Return is the discount rate at which the net present value of a project equals zero.

    IRR represents the expected return generated by an investment project.

    Decision rule:

    • Accept the project if IRR is greater than the required rate of return.
    • Reject the project if IRR is lower than the required return.

    Companies often compare multiple projects and choose the one with the highest IRR, provided it meets their required return threshold.


    Payback Period

    The payback period measures the time required to recover the initial investment.

    For example, if a company invests 20,000 and receives 5,000 annually, the payback period is four years.

    Although simple to calculate, the payback method does not consider the time value of money.


    Profitability Index

    Profitability Index measures value created per unit of investment.

    Profitability Index formula

    Profitability Index = Present value of future cash flows / Initial investment

    If the index is greater than 1, the project is considered acceptable.


    6.2 Cost of Capital

    The cost of capital represents the minimum return that investors expect for providing funds to the company.

    Companies raise capital through:

    • equity financing
    • debt financing

    Investors require compensation for the risk associated with their investment.

    The cost of capital serves as the discount rate used in investment decisions.


    Cost of Equity

    The cost of equity represents the return required by shareholders for investing in the company.

    Shareholders face risk because dividends are not guaranteed and stock prices fluctuate.

    Companies must generate sufficient returns to compensate shareholders for this risk.


    Cost of Debt

    The cost of debt represents the interest rate the company pays on borrowed funds.

    Debt is typically less expensive than equity because interest payments are tax deductible.

    However, excessive borrowing increases financial risk.


    Weighted Average Cost of Capital (WACC)

    Companies often use a combination of debt and equity to finance operations.

    The Weighted Average Cost of Capital represents the average cost of all capital sources.

    WACC formula

    WACC = (Weight of Equity × Cost of Equity) + (Weight of Debt × Cost of Debt)

    WACC is widely used as the discount rate in capital budgeting decisions.


    6.3 Corporate Governance

    Corporate governance refers to the system of rules, practices, and processes used to direct and control a company.

    Good corporate governance ensures that management acts in the best interests of shareholders.

    Poor governance can lead to conflicts of interest and financial misconduct.


    Key Participants in Corporate Governance

    Board of Directors

    The board of directors represents shareholders and oversees management.

    Responsibilities include:

    • approving major strategic decisions
    • monitoring executive performance
    • ensuring regulatory compliance

    Management

    Management is responsible for the day to day operations of the company.

    They implement strategies and manage company resources.


    Shareholders

    Shareholders are the owners of the company and have voting rights on important corporate matters.


    Governance Mechanisms

    Several mechanisms help protect shareholder interests.

    These include:

    • independent board members
    • executive compensation structures
    • regulatory oversight
    • transparent financial reporting

    Strong governance improves investor confidence and company performance.


    6.4 Working Capital Management

    Working capital management focuses on managing a company’s short term assets and liabilities.

    Efficient working capital management ensures that the company has enough liquidity to meet its short term obligations.

    Working capital is calculated as:

    Working Capital = Current Assets − Current Liabilities


    Current Assets

    Current assets are resources expected to be converted into cash within one year.

    Examples include:

    • cash and cash equivalents
    • accounts receivable
    • inventory

    Current Liabilities

    Current liabilities represent short term obligations that must be paid within one year.

    Examples include:

    • accounts payable
    • short term loans
    • accrued expenses

    Importance of Working Capital Management

    Proper working capital management helps companies:

    • maintain liquidity
    • avoid financial distress
    • operate efficiently

    Key Components of Working Capital Management

    Inventory Management

    Companies must maintain optimal inventory levels.

    Too much inventory increases storage costs, while too little inventory can disrupt production.


    Accounts Receivable Management

    Companies must collect payments from customers efficiently.

    Delayed payments can create cash flow problems.


    Accounts Payable Management

    Companies must manage payments to suppliers strategically.

    Delaying payments too long may damage supplier relationships.


    Cash Conversion Cycle

    The cash conversion cycle measures the time required for a company to convert investments in inventory into cash.

    Shorter cash cycles improve liquidity and operational efficiency.

  • Module 5: Financial Statement Analysis

    Financial Statement Analysis is a core component of investment analysis. Investors and analysts use financial statements to evaluate a company’s financial health, profitability, efficiency, and risk profile.

    Public companies are required to publish financial statements periodically so that investors, regulators, and stakeholders can assess their performance. By analyzing these statements, investors can make informed decisions about buying, holding, or selling securities.

    The primary financial statements include:

    • Income Statement
    • Balance Sheet
    • Cash Flow Statement

    Understanding how these statements work together helps investors gain insight into a company’s financial condition.


    5.1 Financial Reporting Framework

    Financial reporting frameworks provide standardized rules that companies must follow when preparing financial statements. These frameworks ensure consistency, transparency, and comparability across companies and industries.

    Two major global accounting standards are commonly used.

    International Financial Reporting Standards (IFRS)

    IFRS is a globally recognized accounting framework used in many countries across Europe, Asia, and other international markets.

    Key features of IFRS include:

    • Principle based accounting approach
    • Greater flexibility in financial reporting
    • Emphasis on fair value measurement

    IFRS allows companies to exercise professional judgment when applying accounting standards, which can lead to differences in financial reporting across firms.


    Generally Accepted Accounting Principles (GAAP)

    GAAP is primarily used in the United States.

    Key features of GAAP include:

    • Rule based accounting system
    • Detailed guidance and regulations
    • Greater consistency in application

    Because GAAP provides more specific rules, it often results in less flexibility compared to IFRS.


    Importance of Financial Reporting Standards

    Accounting standards help ensure that financial information is:

    • Transparent
    • Reliable
    • Comparable across companies

    Without standardized frameworks, investors would struggle to compare financial performance across firms.


    5.2 Income Statement Analysis

    The income statement shows the financial performance of a company over a specific period, usually a quarter or a year.

    It measures how much revenue a company generates and how much profit remains after expenses are deducted.

    The income statement typically follows this structure:

    Revenue
    Minus Cost of Goods Sold
    Equals Gross Profit

    Gross Profit
    Minus Operating Expenses
    Equals Operating Income

    Operating Income
    Minus Taxes and Interest
    Equals Net Income

    Net income represents the company’s final profit.


    Revenue Recognition

    Revenue recognition determines when a company records revenue from its business activities.

    Revenue should generally be recognized when:

    • goods or services are delivered to the customer
    • payment is reasonably assured

    Improper revenue recognition can distort a company’s financial performance.

    For example, recognizing revenue before a product is delivered would inflate reported earnings.


    Expense Classification

    Expenses represent costs incurred to generate revenue.

    Expenses are typically classified into categories such as:

    Cost of Goods Sold
    Direct costs related to producing goods or services.

    Operating Expenses
    Costs required to run the business.

    Examples include:

    • salaries
    • rent
    • marketing expenses

    Interest Expense
    Cost of borrowing funds.

    Taxes
    Government obligations based on profit.

    Understanding expense classification helps analysts evaluate cost efficiency.


    5.3 Balance Sheet Analysis

    The balance sheet provides a snapshot of a company’s financial position at a specific point in time.

    It shows what the company owns and what it owes.

    The fundamental balance sheet equation is:

    Assets = Liabilities + Shareholders Equity


    Assets

    Assets represent economic resources owned by a company that provide future benefits.

    Assets are usually divided into two categories.

    Current Assets
    Assets expected to be converted into cash within one year.

    Examples include:

    • cash and cash equivalents
    • accounts receivable
    • inventory

    Non Current Assets
    Assets used for long term operations.

    Examples include:

    • property and equipment
    • intangible assets
    • long term investments

    Liabilities

    Liabilities represent obligations that a company must pay in the future.

    Liabilities are divided into:

    Current Liabilities
    Obligations due within one year.

    Examples include:

    • accounts payable
    • short term debt

    Long Term Liabilities
    Obligations due after more than one year.

    Examples include:

    • long term loans
    • bonds payable

    Shareholders Equity

    Shareholders equity represents the owners’ claim on the company’s assets after liabilities are deducted.

    Equity includes:

    • common stock
    • retained earnings
    • additional paid in capital

    Retained earnings represent profits that have been reinvested in the business rather than distributed as dividends.


    5.4 Cash Flow Analysis

    While the income statement shows accounting profit, the cash flow statement tracks the actual movement of cash within a company.

    Cash flow analysis helps investors understand whether a company generates sufficient cash to sustain operations.

    The cash flow statement is divided into three sections.


    Operating Activities

    Operating activities represent cash flows generated from a company’s core business operations.

    Examples include:

    • cash received from customers
    • cash paid to suppliers
    • salaries and wages paid to employees

    Positive operating cash flow generally indicates a healthy business.


    Investing Activities

    Investing activities represent cash flows related to the purchase or sale of long term assets.

    Examples include:

    • purchasing equipment
    • selling investments
    • acquiring another company

    Large capital expenditures may reduce cash temporarily but can support long term growth.


    Financing Activities

    Financing activities involve transactions related to funding the company.

    Examples include:

    • issuing new shares
    • borrowing money
    • paying dividends
    • repaying debt

    This section shows how a company raises capital and returns money to investors.


    5.5 Ratio Analysis

    Financial ratios help analysts evaluate a company’s financial performance and compare it with competitors.

    Ratios simplify financial data and highlight important trends.


    Liquidity Ratios

    Liquidity ratios measure a company’s ability to meet short term obligations.

    Current Ratio

    Current Ratio = Current Assets / Current Liabilities

    A higher ratio indicates stronger short term financial stability.

    Quick Ratio

    Quick Ratio = (Current Assets − Inventory) / Current Liabilities

    This ratio measures the ability to pay short term liabilities without relying on inventory.


    Profitability Ratios

    Profitability ratios measure how efficiently a company generates profits.

    Net Profit Margin

    Net Profit Margin = Net Income / Revenue

    Return on Assets (ROA)

    ROA = Net Income / Total Assets

    Return on Equity (ROE)

    ROE = Net Income / Shareholders Equity

    Higher profitability ratios indicate more efficient operations.


    Solvency Ratios

    Solvency ratios measure a company’s ability to meet long term financial obligations.

    Debt to Equity Ratio

    Debt to Equity = Total Debt / Shareholders Equity

    Interest Coverage Ratio

    Interest Coverage = Operating Income / Interest Expense

    Higher solvency ratios indicate stronger financial stability.


    Importance of Ratio Analysis

    Ratio analysis helps investors:

    • evaluate financial performance
    • identify trends over time
    • compare companies within the same industry

    However, ratios should always be interpreted alongside industry benchmarks and broader economic conditions.

  • Module 4: Economics

    Economics helps investors understand how economic forces influence financial markets and investment decisions. Changes in economic conditions affect interest rates, company profits, consumer spending, and overall market performance.

    By studying economics, investors gain insight into how economies function and how economic policies influence financial markets.

    This module covers both microeconomic concepts, which analyze individual markets and consumer behavior, and macroeconomic concepts, which focus on the economy as a whole.


    4.1 Demand and Supply

    Demand and supply form the basic framework used to analyze how markets determine prices and quantities of goods and services.

    The interaction between buyers and sellers determines the equilibrium price in a market.


    Demand

    Demand represents the quantity of a good or service that consumers are willing and able to purchase at different price levels.

    In general, when the price of a good increases, the quantity demanded decreases. This relationship is known as the law of demand.

    Factors that influence demand include:

    • consumer income
    • consumer preferences
    • prices of related goods
    • expectations about future prices
    • population size

    Demand is typically illustrated using a downward sloping demand curve, which shows that lower prices encourage higher consumption.


    Supply

    Supply represents the quantity of a good or service that producers are willing to sell at different price levels.

    When prices increase, producers are generally willing to supply more goods to the market. This relationship is known as the law of supply.

    Factors affecting supply include:

    • production costs
    • technological improvements
    • government regulations
    • number of producers
    • expectations about future prices

    Supply is illustrated using an upward sloping supply curve, which shows that higher prices encourage greater production.


    Market Equilibrium

    Market equilibrium occurs when the quantity demanded equals the quantity supplied.

    At this point:

    • there is no shortage of goods
    • there is no surplus of goods

    If prices are above equilibrium, excess supply will push prices down. If prices are below equilibrium, excess demand will push prices upward.

    Market equilibrium ensures efficient allocation of resources.


    4.2 Elasticity

    Elasticity measures how sensitive the quantity demanded or supplied is to changes in other variables such as price or income.

    Elasticity helps businesses and policymakers understand how consumers and producers respond to changes in market conditions.


    Price Elasticity of Demand

    Price elasticity of demand measures how responsive demand is to changes in price.

    Price Elasticity of Demand = Percentage change in quantity demanded divided by Percentage change in price.

    Types of price elasticity include:

    Elastic demand
    Demand changes significantly when price changes.

    Inelastic demand
    Demand changes very little when price changes.

    Unit elastic demand
    Percentage change in quantity equals percentage change in price.

    Goods such as luxury products tend to have elastic demand, while necessities such as food and medicine tend to have inelastic demand.


    Income Elasticity of Demand

    Income elasticity measures how demand changes when consumer income changes.

    Income Elasticity = Percentage change in quantity demanded divided by Percentage change in income.

    Types include:

    Normal goods
    Demand increases when income increases.

    Inferior goods
    Demand decreases when income increases.

    Income elasticity helps businesses forecast demand as economic conditions change.


    4.3 Market Structures

    Market structure refers to the level of competition and the characteristics of firms operating in a market.

    Different structures influence pricing, output decisions, and market efficiency.


    Perfect Competition

    Perfect competition represents a market with many buyers and sellers offering identical products.

    Key characteristics include:

    • large number of firms
    • identical products
    • free entry and exit
    • firms are price takers

    Agricultural markets are often used as examples of perfect competition.


    Monopoly

    A monopoly exists when a single firm controls the entire market for a product or service.

    Characteristics include:

    • one seller in the market
    • high barriers to entry
    • significant control over prices

    Examples may include utility companies or patented products.

    Monopolies often produce less output and charge higher prices compared to competitive markets.


    Oligopoly

    An oligopoly is a market dominated by a small number of large firms.

    Characteristics include:

    • few large firms
    • significant market power
    • strategic interaction between firms

    Examples include automobile manufacturers and telecommunications companies.

    Firms in oligopolies often consider competitors’ actions when making pricing decisions.


    4.4 Monetary Policy

    Monetary policy refers to actions taken by central banks to manage money supply and interest rates in an economy.

    Central banks use monetary policy to control inflation, stabilize the financial system, and promote economic growth.

    Examples of central banks include the Federal Reserve in the United States and the Reserve Bank of India.


    Interest Rate Adjustments

    Central banks influence borrowing and spending by adjusting interest rates.

    Lower interest rates encourage borrowing and investment.

    Higher interest rates discourage borrowing and help control inflation.

    Interest rate changes affect:

    • consumer spending
    • business investment
    • stock market performance

    Open Market Operations

    Open market operations involve buying or selling government securities in financial markets.

    When the central bank buys securities, it increases money supply in the economy.

    When the central bank sells securities, it reduces money supply.

    These operations are used to manage liquidity and stabilize financial markets.


    4.5 Fiscal Policy

    Fiscal policy refers to government decisions regarding taxation and spending.

    Governments use fiscal policy to influence economic activity.


    Government Spending

    Government spending includes investments in infrastructure, healthcare, education, and public services.

    Increased government spending can stimulate economic activity during periods of economic slowdown.


    Budget Deficits

    A budget deficit occurs when government spending exceeds tax revenues.

    Persistent deficits increase public debt and may affect long term economic stability.


    Government Stimulus

    During economic downturns, governments may introduce stimulus programs to boost economic activity.

    Stimulus measures may include:

    • tax reductions
    • infrastructure spending
    • financial support for businesses

    4.6 Economic Growth and Business Cycles

    Economic growth refers to the increase in a country’s production of goods and services over time.

    Business cycles describe the natural fluctuations in economic activity.


    GDP Growth

    Gross Domestic Product (GDP) measures the total value of goods and services produced in an economy.

    Increasing GDP indicates economic expansion.

    Declining GDP may signal economic recession.


    Inflation

    Inflation represents the rate at which the general level of prices increases over time.

    Moderate inflation is normal in growing economies, but excessive inflation reduces purchasing power.

    Central banks aim to maintain stable inflation levels.


    Unemployment

    Unemployment measures the percentage of the labor force that is actively seeking work but unable to find employment.

    High unemployment often occurs during economic recessions.

    Low unemployment generally indicates strong economic activity.


    4.7 Currency Exchange Rates

    Exchange rates determine the value of one currency relative to another.

    Exchange rate movements affect international trade, investments, and capital flows.


    Currency Appreciation

    Currency appreciation occurs when the value of a country’s currency increases relative to other currencies.

    A stronger currency makes imports cheaper but exports more expensive.


    Purchasing Power Parity

    Purchasing Power Parity (PPP) states that exchange rates should adjust so that identical goods cost the same in different countries when expressed in a common currency.

    PPP helps economists understand long term exchange rate movements.

  • Module 3: Quantitative Methods

    Quantitative methods provide the mathematical and statistical tools used in financial analysis. Investment professionals rely on these tools to evaluate investments, measure risk, analyze financial data, and make evidence based decisions.

    In finance, quantitative methods help answer questions such as:

    • How much will an investment grow over time
    • How risky is a portfolio
    • What is the probability of certain market outcomes
    • Whether an investment strategy truly generates abnormal returns

    This module introduces the core mathematical and statistical concepts used throughout the CFA curriculum.


    3.1 Time Value of Money

    The Time Value of Money (TVM) is one of the most fundamental concepts in finance. It states that a unit of money today is worth more than the same unit of money in the future because the money today can be invested to earn returns.

    For example, if an investor receives 100 today and invests it at 5 percent interest, it will grow to 105 in one year. Therefore, 100 today is more valuable than receiving 100 one year later.

    TVM allows financial analysts to compare cash flows occurring at different points in time.


    Future Value

    Future value calculates how much an investment today will grow after earning interest for a specific period.

    FV=PV(1+r)nFV = PV(1+r)^n

    Where
    FV = future value of the investment
    PV = present value or initial investment
    r = interest rate per period
    n = number of periods

    Example
    If an investor deposits 2000 into a savings account that earns 6 percent annually for 4 years, the future value can be calculated using the compounding formula above.

    Future value calculations are widely used in:

    • retirement planning
    • savings growth projections
    • investment planning

    Present Value

    Present value determines the current worth of a future cash flow after adjusting for the time value of money.

    PV=FV(1+r)nPV = \frac{FV}{(1+r)^n}

    Where
    PV = present value
    FV = future value
    r = discount rate
    n = number of periods

    Present value is used to determine how much a future payment is worth today.

    Example
    If an investor expects to receive 5000 in three years and the discount rate is 8 percent, the present value will be lower than 5000.


    Compounding

    Compounding refers to earning interest on both the original investment and accumulated interest.

    As time passes, interest begins to generate additional interest.

    Types of compounding include:

    • annual compounding
    • semi annual compounding
    • quarterly compounding
    • monthly compounding
    • continuous compounding

    More frequent compounding leads to a higher future value.


    Discounting

    Discounting is the opposite of compounding. It converts future cash flows into their present value.

    Investors use discounting to determine whether a future payment or investment opportunity is worthwhile today.

    Discounting is used extensively in:

    • stock valuation
    • bond pricing
    • capital budgeting

    Applications of Time Value of Money

    Loan Calculations

    Banks calculate loan payments using TVM concepts.

    Examples include:

    • mortgage payments
    • personal loans
    • car loans

    Loan payments consist of both principal repayment and interest payments.


    Investment Valuation

    Investors use TVM to evaluate the attractiveness of investments.

    Examples include:

    • valuing bonds
    • evaluating business projects
    • retirement savings planning

    3.2 Cash Flow Analysis

    Many investments involve multiple cash flows over time. Cash flow analysis helps investors determine whether an investment will generate value.

    Two important tools used in investment analysis are:

    • Net Present Value
    • Internal Rate of Return

    Net Present Value

    Net Present Value measures the difference between the present value of future cash inflows and the initial investment.

    NPV=t=0nCFt(1+r)tNPV = \sum_{t=0}^{n} \frac{CF_t}{(1+r)^t}

    Where
    CF = cash flow at time t
    r = discount rate
    t = time period

    Decision rule

    • If NPV is positive, the investment creates value
    • If NPV is negative, the investment should be rejected

    Example
    A company invests 10000 in a project expected to generate future cash flows. By discounting these cash flows, the firm determines whether the project increases shareholder wealth.


    Internal Rate of Return

    Internal Rate of Return is the discount rate that makes the net present value of a project equal to zero.

    It represents the expected return generated by an investment.

    Decision rule

    • Accept the project if IRR is greater than the required rate of return
    • Reject the project if IRR is lower than the required rate

    IRR is commonly used in:

    • project evaluation
    • private equity investments
    • capital budgeting decisions

    Investment Decision Rules

    Investment managers often evaluate projects using several rules.

    NPV Rule
    Accept investments that have a positive NPV.

    IRR Rule
    Accept investments with an IRR higher than the required return.

    Payback Period
    Measures how long it takes to recover the initial investment.

    Profitability Index
    Measures value created per unit of investment.


    3.3 Descriptive Statistics

    Descriptive statistics summarize and describe characteristics of financial data.

    Financial analysts frequently analyze datasets such as:

    • stock returns
    • bond yields
    • economic indicators

    These statistics help investors understand return patterns and risk.


    Measures of Central Tendency

    These measures represent the typical or average value in a dataset.

    Mean
    The arithmetic average of observations.

    Median
    The middle value when observations are arranged in order.

    Mode
    The most frequently occurring value.


    Measures of Dispersion

    Dispersion measures how spread out data points are.

    Variance measures the average squared deviation from the mean.

    σ2=1Ni=1N(xiμ)2\sigma^2 = \frac{1}{N}\sum_{i=1}^{N}(x_i-\mu)^2

    Standard deviation is the square root of variance and measures volatility of returns.

    Higher standard deviation indicates higher investment risk.


    Distribution Characteristics

    Financial data often displays unique distribution patterns.

    Skewness measures asymmetry of a distribution.

    Positive skew means a longer right tail.

    Negative skew means a longer left tail.

    Kurtosis measures the degree of extreme outcomes in a distribution.

    High kurtosis indicates greater probability of extreme events.


    3.4 Probability Concepts

    Probability helps investors evaluate uncertainty and estimate potential outcomes.

    In finance, probability is used to assess risk and forecast market behavior.


    Basic Probability Rules

    Probability values range between 0 and 1.

    Key rules include:

    Addition rule
    Probability that event A or event B occurs.

    Multiplication rule
    Probability that two independent events occur together.


    Conditional Probability

    Conditional probability measures the probability of an event occurring given that another event has already occurred.

    For example, the probability that a company defaults given that its credit rating has been downgraded.

    Conditional probability helps analysts assess risk relationships.


    Expected Value

    Expected value represents the average outcome of a random variable.

    It is calculated by multiplying each outcome by its probability and summing the results.

    Expected return is a key concept in portfolio management.

    Investors use expected value to compare investment opportunities.


    3.5 Sampling and Estimation

    In many situations, analyzing the entire population of data is not practical. Instead, analysts use samples to estimate population characteristics.

    Sampling allows analysts to draw conclusions about a larger population using a smaller dataset.


    Sampling Methods

    Simple Random Sampling
    Each observation has an equal probability of being selected.

    Stratified Sampling
    Population is divided into groups and samples are drawn from each group.

    Systematic Sampling
    Observations are selected at regular intervals.


    Estimation of Population Parameters

    Using sample data, analysts estimate parameters such as:

    • population mean
    • population variance

    Confidence intervals provide a range within which the true population parameter is expected to lie.


    3.6 Hypothesis Testing

    Hypothesis testing is used to determine whether a statistical claim is supported by data.

    It is widely used in finance to test investment strategies and market theories.


    Null Hypothesis

    The null hypothesis represents the assumption that no relationship or difference exists.

    Example
    A portfolio manager does not generate returns above the market benchmark.


    Alternative Hypothesis

    The alternative hypothesis represents the claim being tested.

    Example
    The portfolio manager consistently outperforms the market.


    Test Statistics

    Test statistics measure how far the sample result deviates from the null hypothesis.

    Common statistics include:

    • z statistic
    • t statistic

    These statistics help determine whether results are statistically significant.


    Confidence Intervals

    Confidence intervals estimate the range within which the true population parameter lies.

    For example, analysts may estimate that the average return of a portfolio lies between two values with 95 percent confidence.

    Confidence intervals help measure reliability of estimates.


    3.7 Correlation and Regression

    Correlation and regression help analyze relationships between financial variables.


    Correlation

    Correlation measures the strength and direction of the relationship between two variables.

    The correlation coefficient ranges between:

    -1 and +1

    Positive correlation means variables move in the same direction.

    Negative correlation means variables move in opposite directions.

    Low correlation between assets helps reduce portfolio risk.


    Regression Analysis

    Regression analysis estimates the relationship between a dependent variable and one or more independent variables.

    y=a+bxy = a + bx

    Where
    y = dependent variable
    x = independent variable
    a = intercept
    b = slope coefficient

    Regression analysis is used to estimate relationships between market factors and asset returns.