An indifference curve is an important concept in economics. It helps us understand how a consumer chooses between two goods when both provide satisfaction.
In simple words, an indifference curve shows different combinations of two goods that give the same level of satisfaction to a consumer.
The consumer is indifferent between those combinations because each combination gives equal utility.
What is an Indifference Curve?
An indifference curve is a graph that shows different bundles of two goods that provide the same satisfaction.
For example, assume a student likes both pizza and burgers.
The student may be equally satisfied with:
2 pizzas and 4 burgers
3 pizzas and 2 burgers
4 pizzas and 1 burger
If all these combinations give the same satisfaction, they can be shown on the same indifference curve.
The student does not prefer one combination over the other. That is why it is called an indifference curve.
Simple Example
Suppose a consumer has two goods: tea and coffee.
The consumer may feel equally satisfied with the following combinations:
| Combination | Cups of Tea | Cups of Coffee |
| A | 1 | 6 |
| B | 2 | 4 |
| C | 3 | 3 |
| D | 4 | 2 |
Each combination gives the same satisfaction to the consumer.
If the consumer gets more tea, they are willing to give up some coffee and still remain equally satisfied.
This trade-off between two goods is the main idea behind an indifference curve.
Real Life Context
Think of a person planning monthly food spending.
They like eating out and also ordering food at home. Both give satisfaction, but the person has limited money.
One month, the person may choose to eat out 4 times and order food 2 times.
Another month, they may eat out 2 times and order food 5 times.
If both options give the same satisfaction, the person is indifferent between them.
This is how an indifference curve works in real life. It shows how people make choices when they have to balance one good against another.
Why an Indifference Curve Slopes Downward
An indifference curve usually slopes downward from left to right.
This means that if a consumer gets more of one good, they must give up some amount of the other good to remain at the same satisfaction level.
For example, if a person gets more coffee, they may be willing to consume less tea.
If they get more of both tea and coffee, satisfaction will increase, and they will move to a higher indifference curve.
Marginal Rate of Substitution
The slope of an indifference curve is called the Marginal Rate of Substitution, or MRS.
MRS shows how much of one good a consumer is willing to give up to get one more unit of another good while keeping satisfaction the same.
For example, if a consumer is willing to give up 2 cups of tea for 1 extra cup of coffee, the MRS is 2.
As the consumer gets more coffee, they may become less willing to give up tea. This is why indifference curves are usually convex to the origin.
Important Features of Indifference Curves
Indifference curves have a few important features.
First, they slope downward because consumers trade one good for another.
Second, they are convex to the origin because the willingness to substitute one good for another usually falls as the consumer gets more of one good.
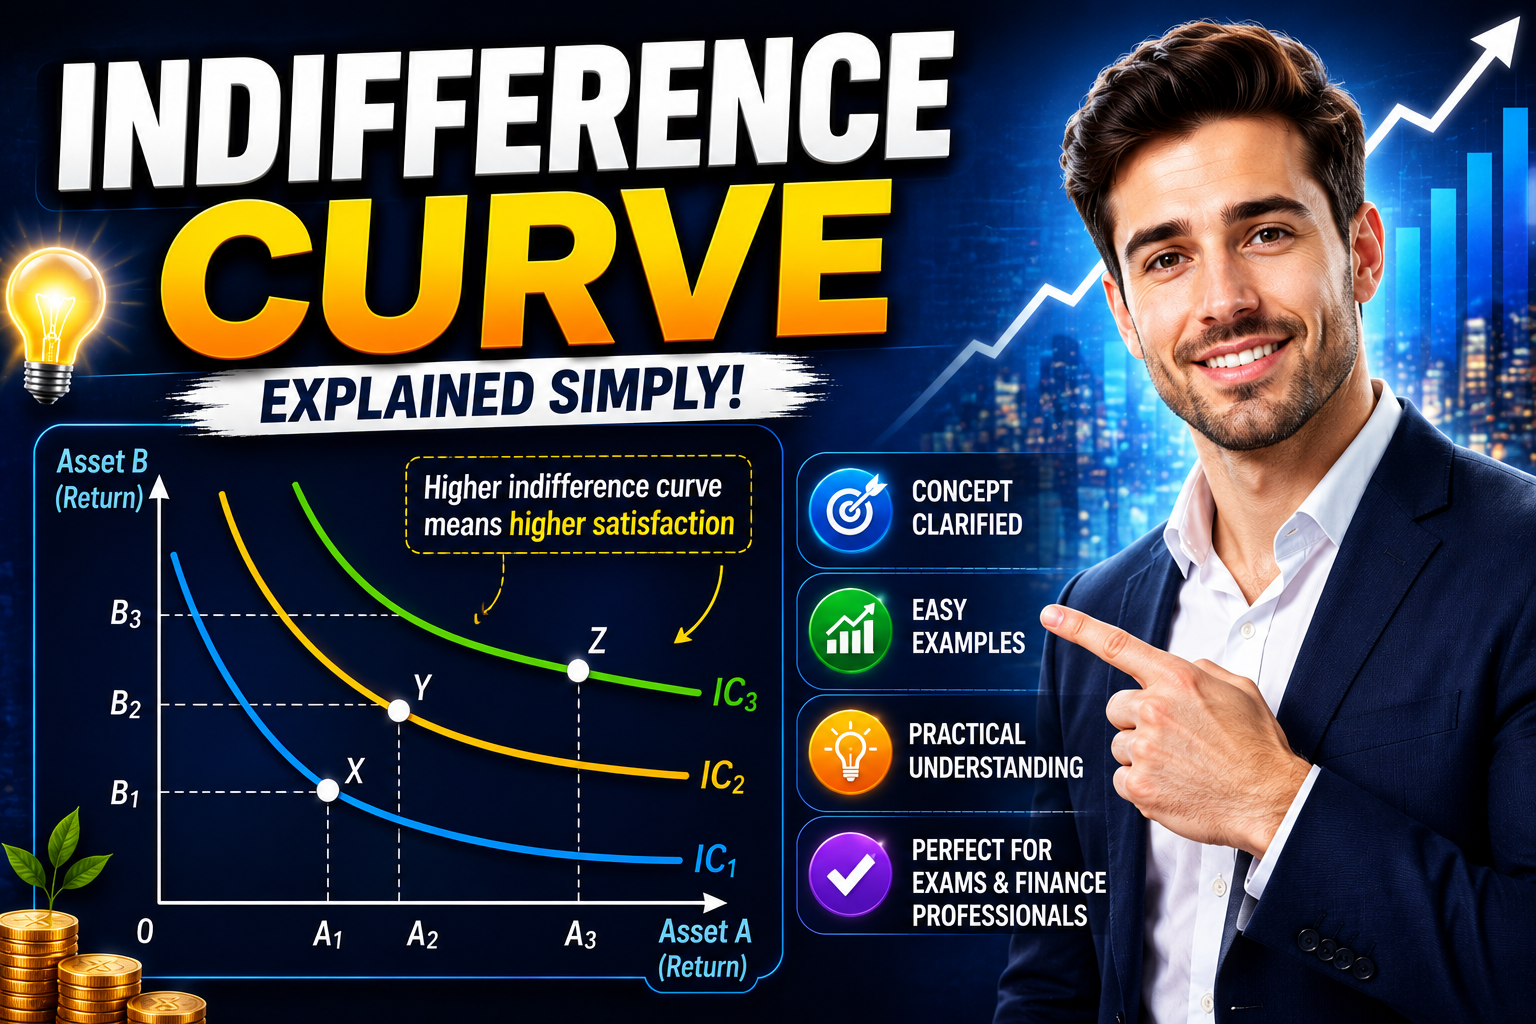
Third, a higher indifference curve shows a higher level of satisfaction.
Fourth, two indifference curves do not intersect because one combination cannot represent two different levels of satisfaction at the same time.
Indifference Curve and Budget Constraint
An indifference curve shows what a consumer wants.
A budget constraint shows what a consumer can afford.
The best choice happens where the consumer reaches the highest possible indifference curve within the budget limit.
In real life, people do not only choose what they like. They also choose what they can afford.
For example, a student may like both movies and eating out. But with a fixed monthly budget, the student must decide the best combination of both.
Final Thoughts
An indifference curve explains consumer choice in a simple way.
It shows how a person balances two goods that provide satisfaction. It also helps explain trade-offs, preferences, and decision-making under limited resources.
The easiest way to remember it is this:
An indifference curve shows different combinations of two goods that give the same satisfaction to a consumer.
Leave a Reply